Bitcoin Price Analysis: Another Failure At $10,000 – Is It a Matter Of Time, Or a Wild Dump Below $9K Incoming?
Bitcoin wakes up to a new week following a volatile weekend: After reaching down to $9100 on Friday, the following two weekend days were quite bullish for the primary cryptocurrency.
Bitcoin regained position, and since the Friday’s low, the price had been climbing nicely to the same devastating resistance area below the $10,000 mark.
However, as of writing these lines, the price quickly rejected and plunged below the $9600 zone. This Is the third attempt to break the benchmark level over the past ten days.
3 Attempts, 3 Failures: What’s Next?
Is it a matter of time until Bitcoin breaks the tough resistance? Or, on the other hand, Will Bitcoin lose momentum and get away from the 5-digit area?
As of writing these lines, there are reasons for both scenarios.
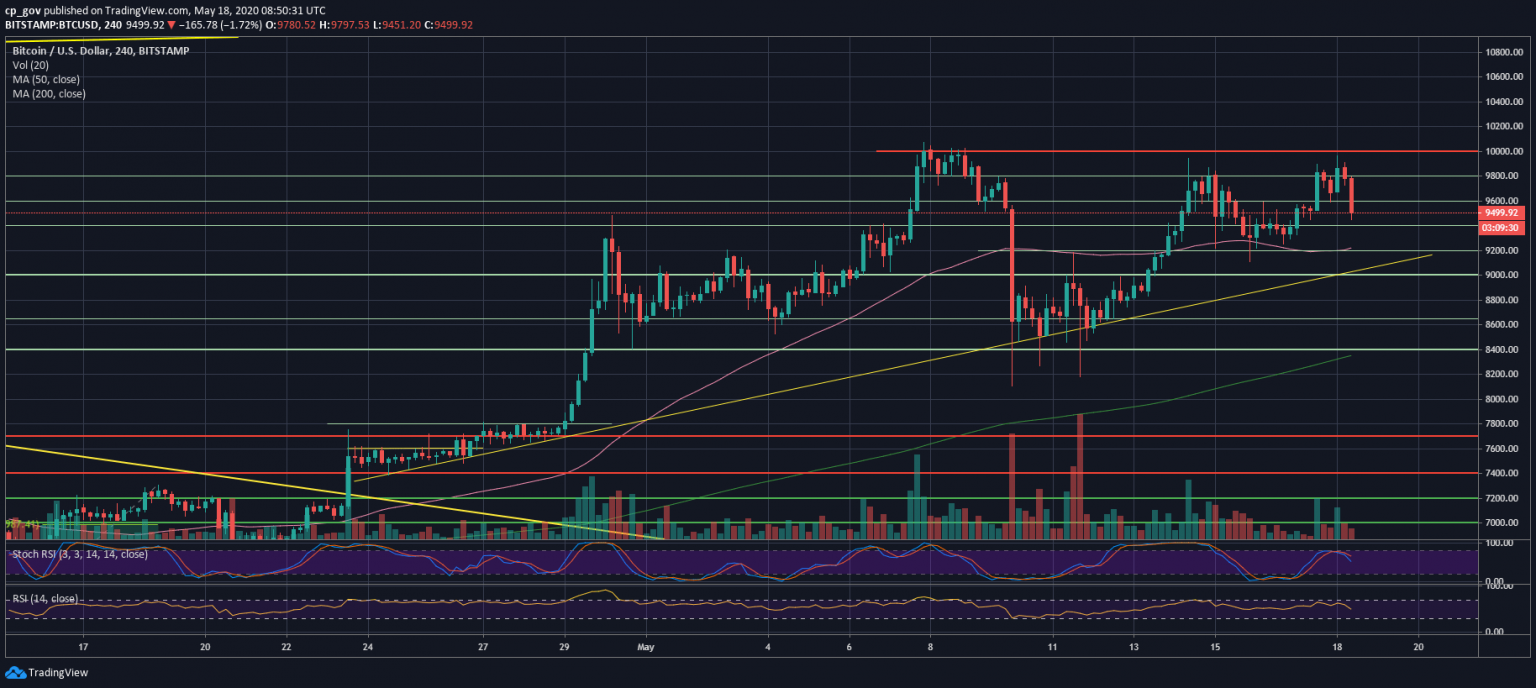
From the bullish side, since the halving and the plunge to $8000 on the same day, we see a nice higher lows trajectory on the short-term chart. We also have to remember that the more attempts to break a level, the higher the chance for a breakout to take place.
Besides, on the short-time frame, we can identify a classic cup and handle formation, which is bullish once the neckline – yes, around $10,000 – gets broken above.
Together with the momentum incoming from the global markets, which forecast a nice green 1-2% increase on Monday’s trading day, Bitcoin should do it.
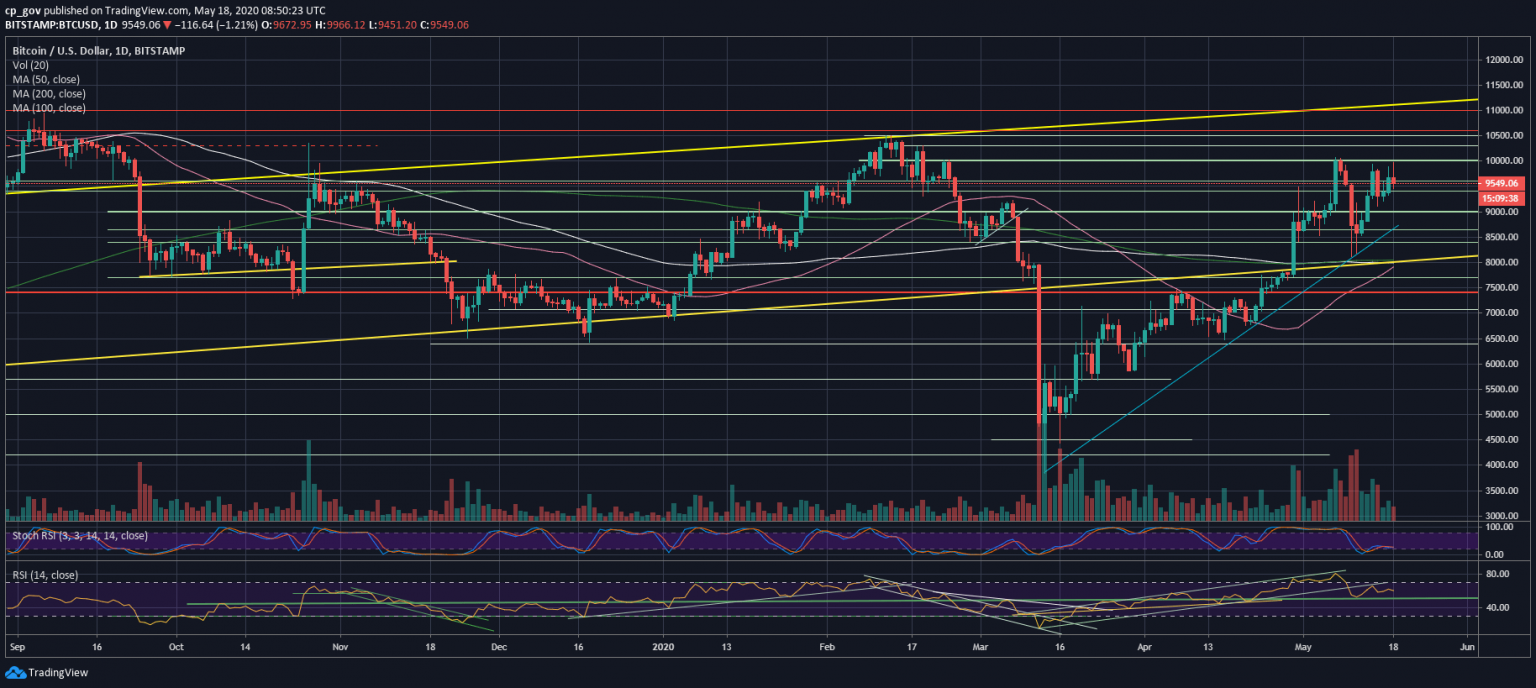
On the other hand, the RSI, which is the momentum indicator, still carrying the bearish divergence as we pointed out two days ago. While the price is again around $10,000, the RSI indicator on both the 4-hour and the daily is lower than during the previous attempt.
Just like the RSI, the trading volume is declining over the recent three attempts. This can be a sign of an incoming price move. However, decreasing volume means that the trials are actually losing force overtime.
In any case, if a breakout takes place, we expect a wild move towards the next major resistance at $10,400 – $10,500.
From the other side, in case Bitcoin fails here, then the first support level is around $9600, followed by $9300 – $9400, $9100 and $8900.
Total Market Cap: $267 billion
Bitcoin Market Cap: $179.6 billion
BTC Dominance Index: 67.1%
*Data by CoinGecko
BTC/USD BitStamp 4-Hour Chart
BTC/USD BitStamp 1-Day Chart
source: cryptopotato.com