Ethereum Gets Stopped Just Short of an All-Time High
- Ethereum has support at $952, $830, and $756.
- ETH is likely in wave 4 of a bullish impulse.
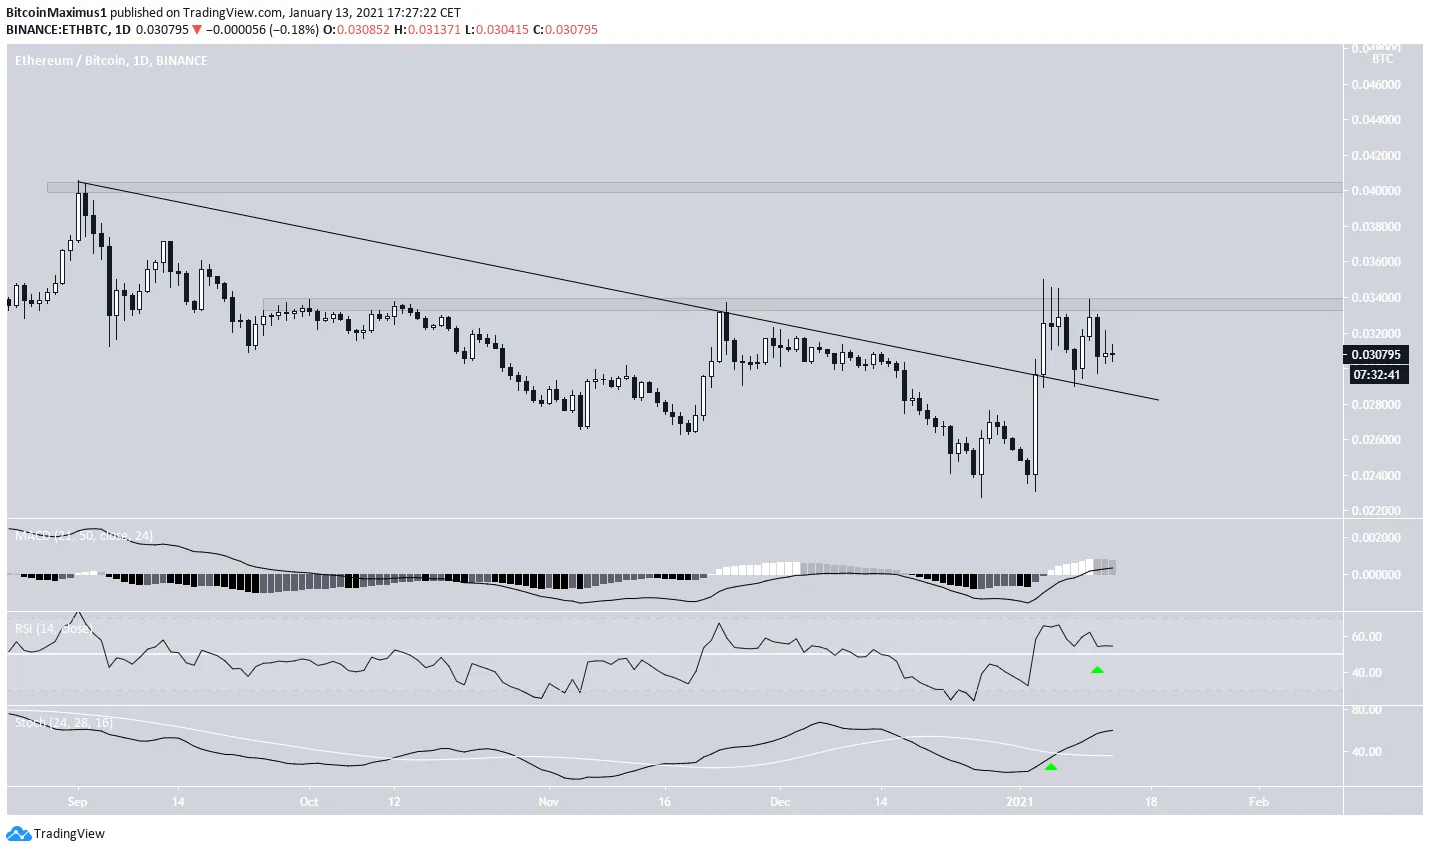
- ETH/BTC is facing resistance at ₿0.034 and ₿0.04
Ethereum (ETH) nearly reached a new all-time high at the beginning of January but was rejected less than $100 away.
While Ethereum seems to be correcting in the short-term, it is expected to eventually initiate another upward move and reach a new all-time high.
Ethereum Denied New High
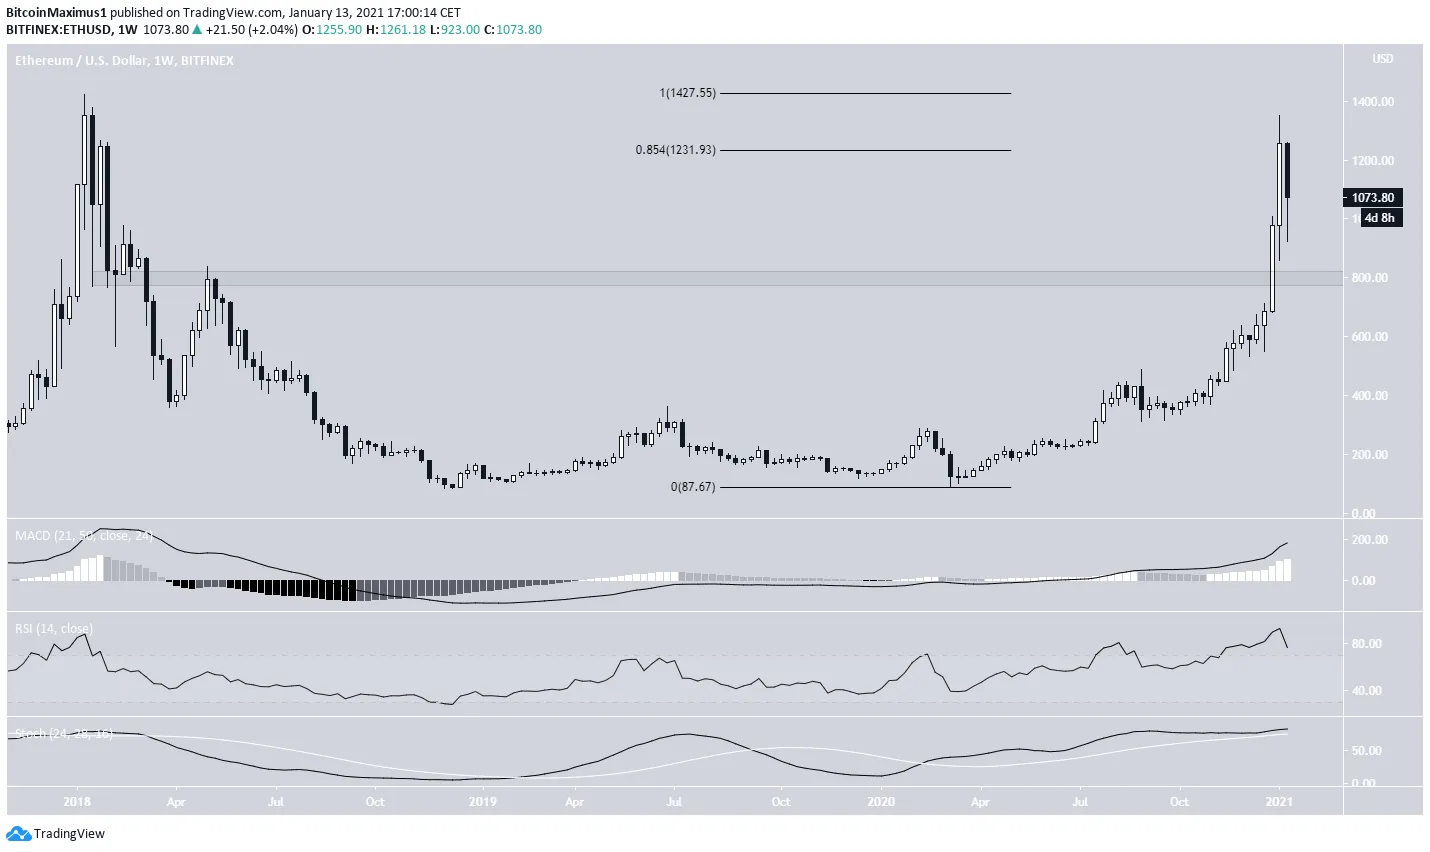
The weekly chart shows that ETH nearly reached a new all-time high on Jan. 10, but was rejected by the 0.854 Fib retracement level. This is the final resistance area before the all-time high price.
Despite the decrease, long-term indicators for ETH are still bullish, suggesting that the upward move is expected to continue. However, due to the rapid rate at which it increased, the closest support area is found at $800.
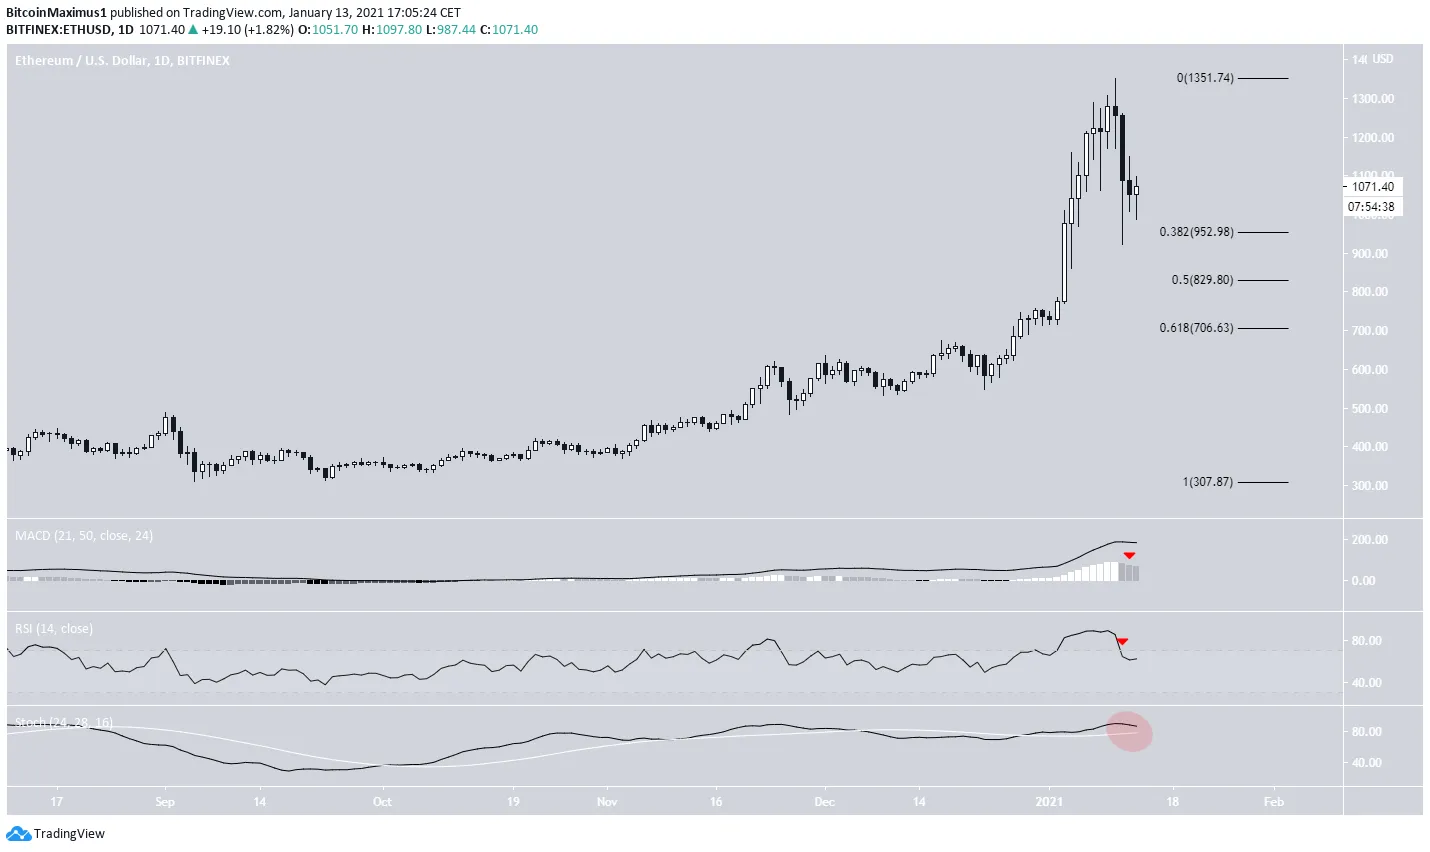
The daily chart shows that ETH has bounced at the 0.382 Fib retracement level at $952, and created a long lower wick in the process.
The next significant support areas are created by the 0.5 and 0.618 Fib retracement levels at $829 and $706 respectively. The latter Fib also coincides with a horizontal support level.
Technical indicators in the daily time-frame are bearish, so it’s possible that ETH is still correcting and could drop until it finds support at one of the aforementioned levels.
Wave Count
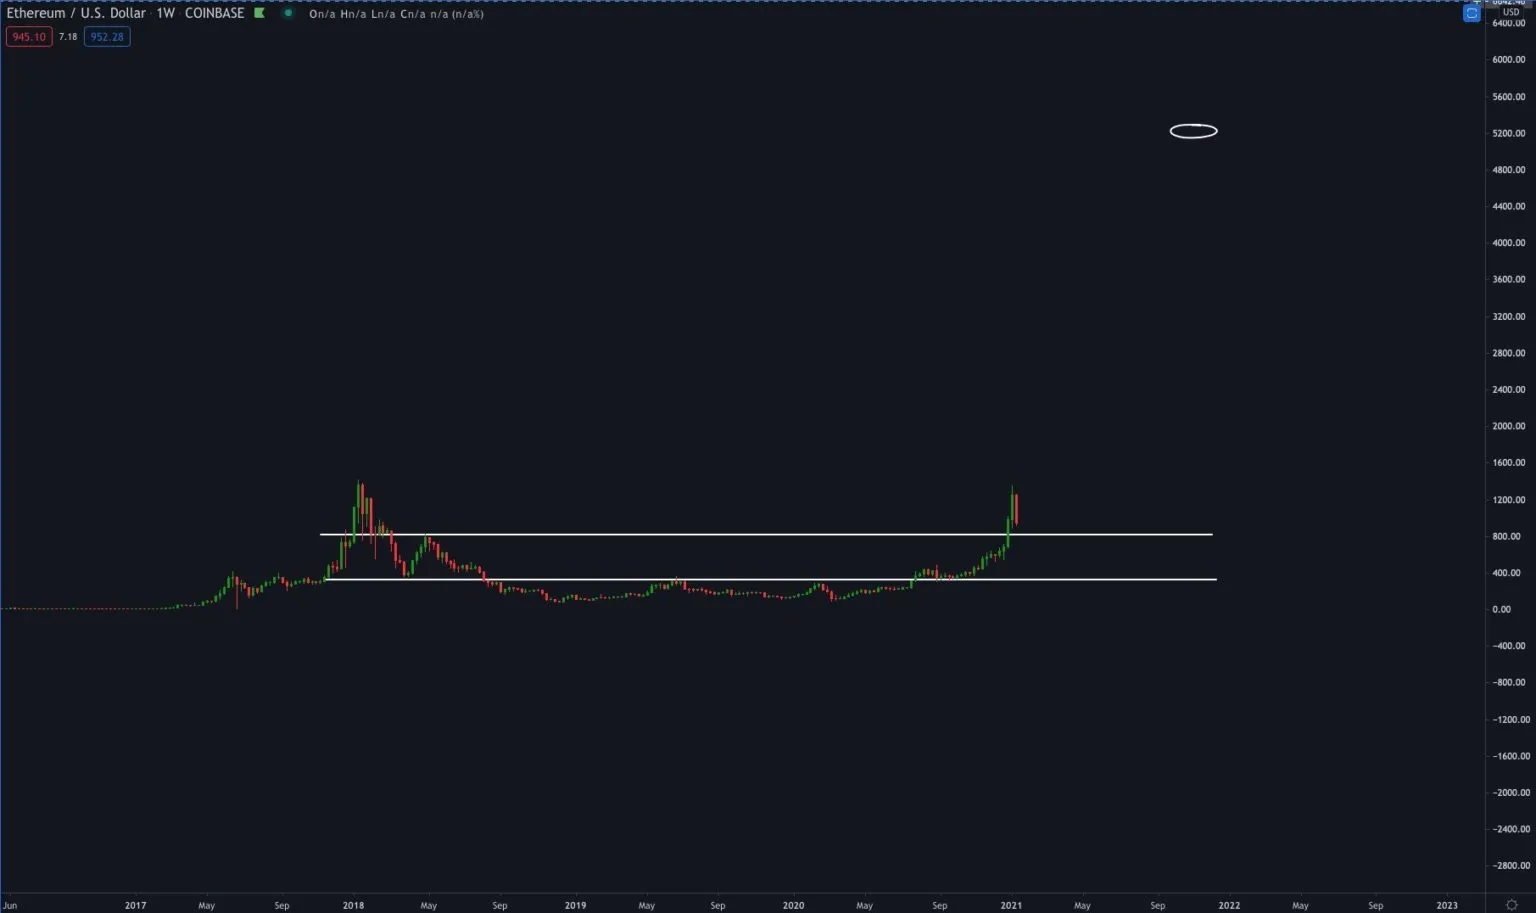
Cryptocurrency trader @Cryptotrooper_ tweeted a chart showing that ETH has moved above the previous resistance area at $800, and gave a target all the way at $5,200.
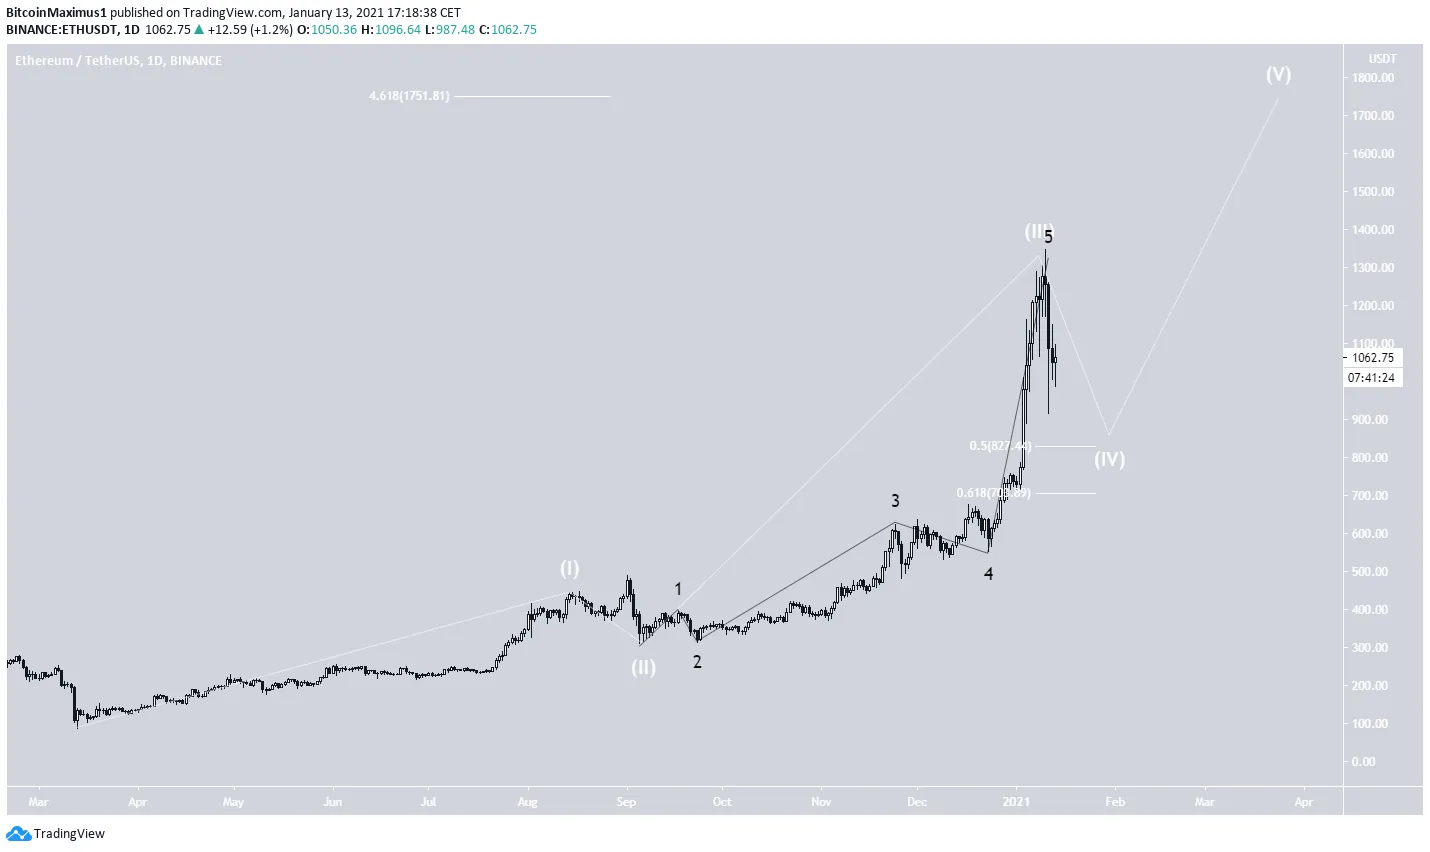
Beginning in March, ETH indeed began a bullish impulse and is currently in wave 4 (shown in white below).
While it is likely that wave 4 ends at either the 0.5 or 0.618 Fib retracement levels, it could possibly develop into a fourth wave triangle. In this scenario, ETH would have already reached its low.
Nevertheless, while it looks almost certain that ETH is in wave 4, the corrective wave has just begun so we cannot yet determine its shape.
A more conservative target for the potential top of the move is found at $1,751 — the 4.61 Fib extension of wave 1.
ETH/BTC
The ETH/BTC pair shows a breakout from a descending resistance line that had been in place since September 2020 and its subsequent validation.
However, ETH was rejected by the ₿0.034 resistance area and is now consolidating below it.
Technical indicators in the daily time-frame are bullish, suggesting that ETH will be successful in breaking out above ₿0.034 and move towards ₿0.04.
Conclusion
Ethereum seems to be correcting inside a long-term wave 4 but is expected to initiate another upward move after the pattern is complete.
Similarly, ETH/BTC seems to be consolidating in anticipation of a breakout.
Source: beincrypto.com