Bitcoin, Ethereum, and XRP Prepare to Enter Volatile Price Territory
Bitcoin, Ethereum, and XRP prepare for major price action despite recent losses.
Bitcoin at a Pivotal Point
The flagship cryptocurrency continues consolidating without a clear sign of where it is headed next. Its price has been making a series of higher lows over the past two months. However, the $10,000 resistance level continues to hold, rejecting movement to the upside.
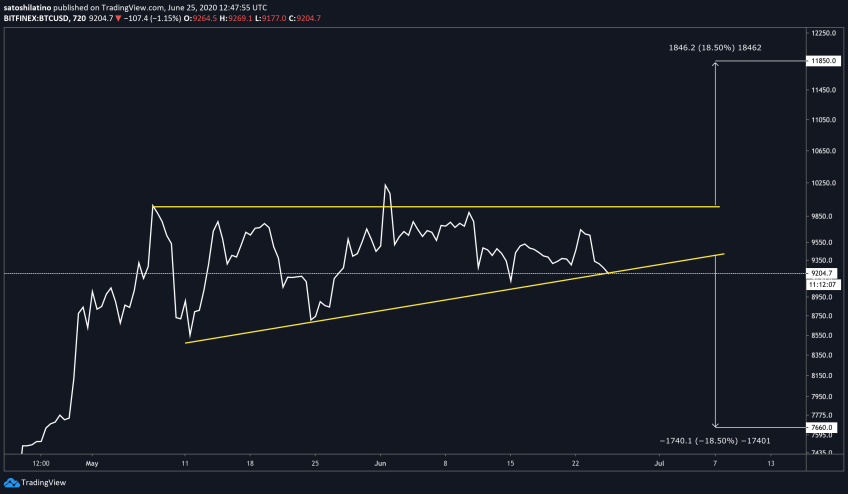
The lackluster price action led to the development of an ascending triangle on Bitcoin’s 12-hour chart. This technical formation is considered to be a continuation pattern that estimates an 18.5% target upon the breakout point.
A significant spike in demand for BTC will allow it to finally break above the overhead resistance, which may ignite a state FOMO among investors. If this were to happen, the pioneer cryptocurrency could rise towards $12,000 based on the technical pattern shown below.
Breaking below the hypothenuse of the ascending triangle, however, will invalidate the bullish outlook and present an opportunity for sidelined investors to get back into the market. Under such conditions, the downswing could trigger a sell-off that pushes Bitcoin to $7,700 or lower.
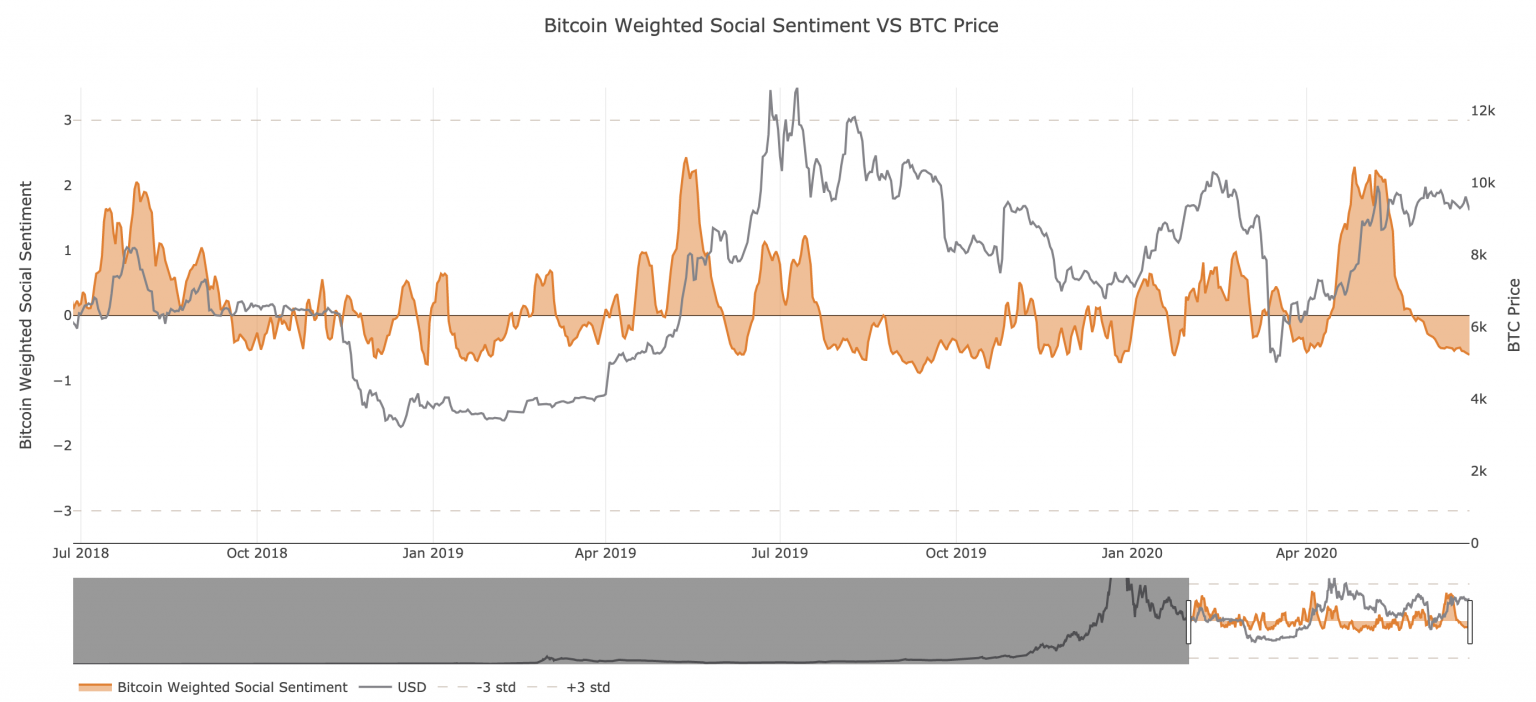
Given the ambiguous outlook for the bellwether cryptocurrency, and with 14,000 BTC options expiring this Friday, market participants “fear” about what the future may hold. Indeed, Santiment’s Social Sentiment index reveals that the chatter around Bitcoin on Twitter is mostly negative due to the recent price action.
“The stagnation that has began to take place over these past six weeks or so has had a lot to do with this shift in mindset, as traders tend to become complacent and unenthusiastic about an asset that traditionally has the reputation of being volatile, after enough time elapses without major movement,”
– said Santiment.
Despite the pessimism around Bitcoin, opportunities for profit are abundant when fear reigns the market. It remains to be seen whether support or resistance will break first to provide a clear picture of where that flagship cryptocurrency is headed next.
Ethereum Plunges and Consolidates
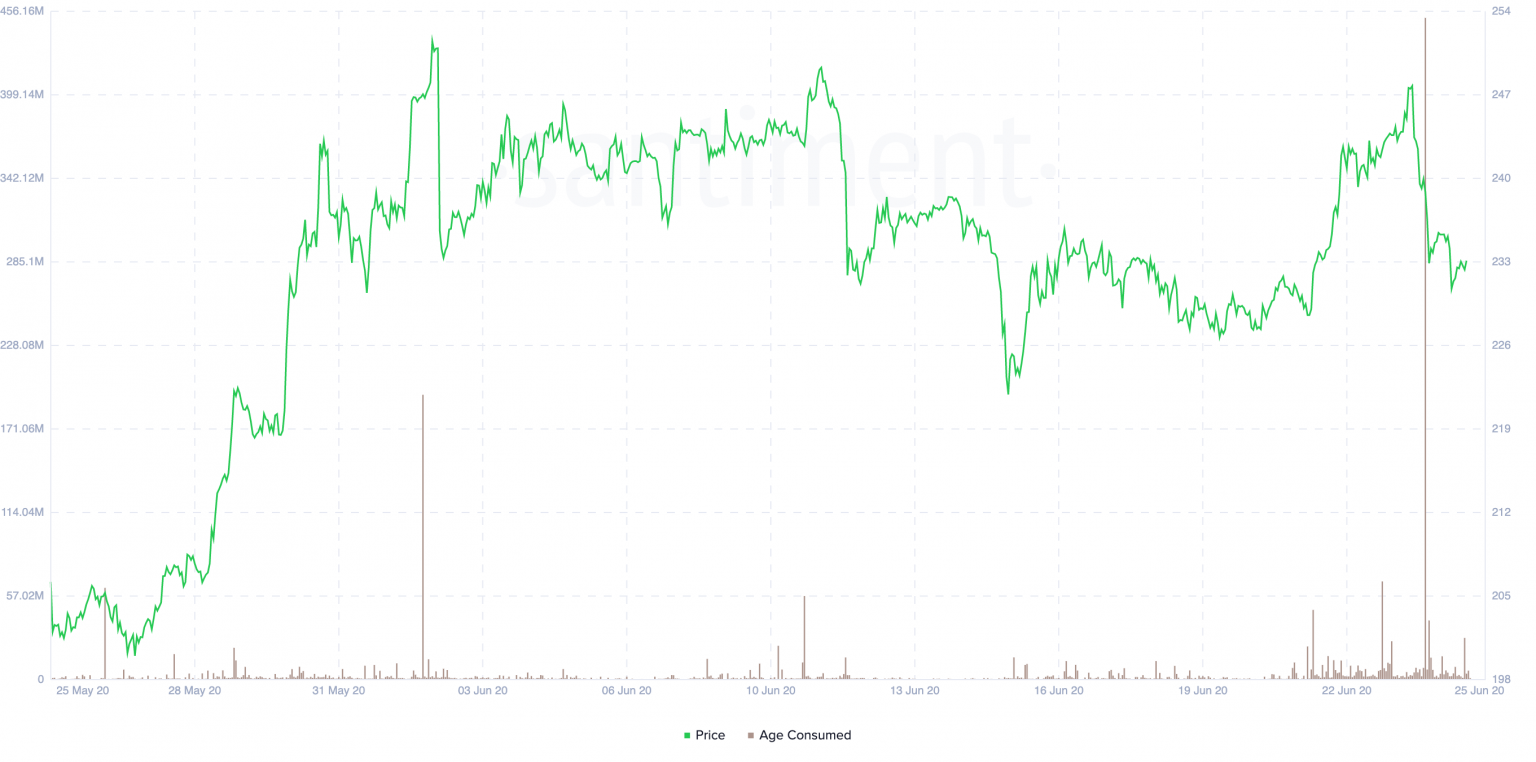
The smart contracts giant saw its price drop by nearly 9% in the past 30 hours. The sudden bearish impulse seems to have been predicted by Santiment’s Token Age Consumed index, which registered a substantial spike in idle ETH tokens exchanging hands.
“Spikes in ‘Token Age Consumed’ can signal changes in the behavior of some long-term holders, and tend to precede increased volatility for the coin’s price action,”
according to Santiment.
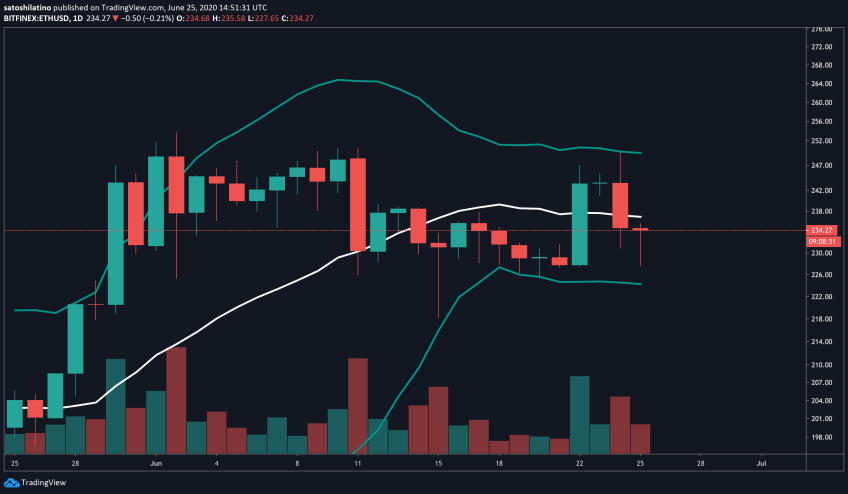
From a technical perspective, however, Ethereum is going through a stagnation phase that has forced its Bollinger bands to squeeze on its 1-day chart. Squeezes are indicative of periods of low volatility and are usually succeeded by wild price movement. Although the current squeeze began to take place in mid-June, there is a high probability of a strong breakout once either support or resistance is breached.
ETH’s 4-hour chart paints a better picture of where it could be headed next. Within this time frame, Ether’s price action appears to be contained within a parallel channel since the beginning of the month.
Since then, each time Ethereum surges to reach the upper boundary of the channel, it gets rejected by this hurdle and retraces to the lower boundary. This support level is usually stacked with buy orders that help Ether bounce back up again.
Based on the recent price action, it is reasonable to expect a rebound towards the middle or upper boundary of the channel. But a significant price movement will take place when the Ethereum turns the $250 resistance into support. Such an upswing could see it rise towards $300.
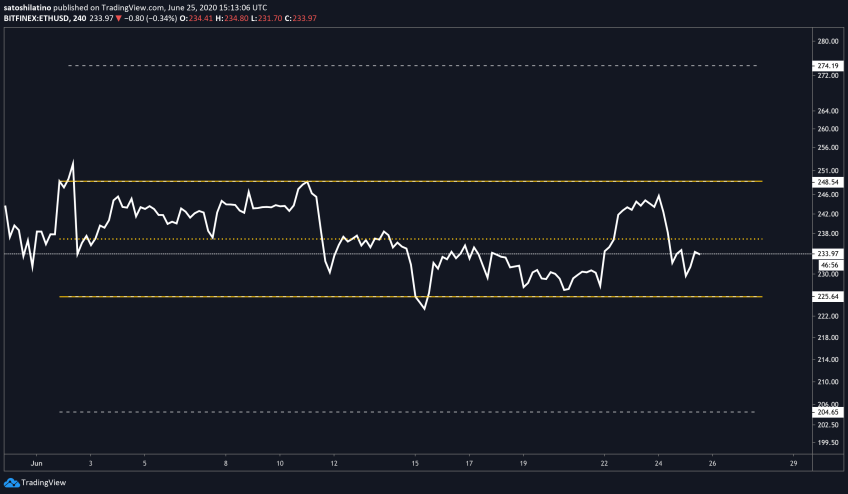
On the flip side, an increase in sell orders that sends Ether below the $225 support level will increase the odds for a further downturn. If this were to happen, the next key support barrier to pay attention to sits around $200.
XRP Regaining Critical Resistance
The selling pressure behind XRP over the past 30 hours was significant enough to allow it to break below the 38.2% Fibonacci retracement level. This support wall was holding the price of this cryptocurrency from a further decline since mid-May. For this reason, the recent break can be seen as a sign that XRP has more room to go down.
A further increase in sell orders behind the cross-border remittances token may see it fall towards the 50% or 61.8% Fibonacci retracement levels. These areas of support sit at $0.17 and $0.16, respectively.
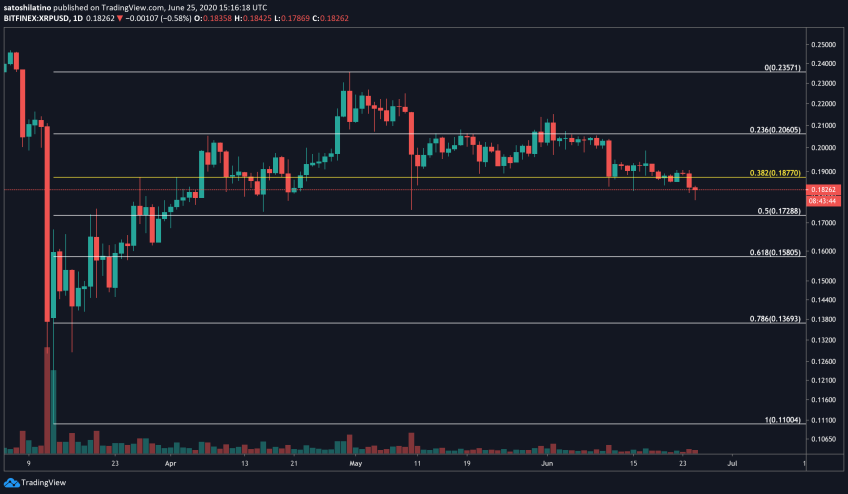
Nonetheless, the TD sequential indicator is currently presenting a buy signal in the form of a red nine candlestick on XRP’s 4-hour chart. The bullish formation forecasts a one to four candlestick correction or the beginning of a new upward countdown.
If this buy signal is validated and XRP manages to regain the 38.2% Fibonacci retracement level as support, the odds for a further decline will be drastically reduced, subsequently increasing the probability for a further advance.
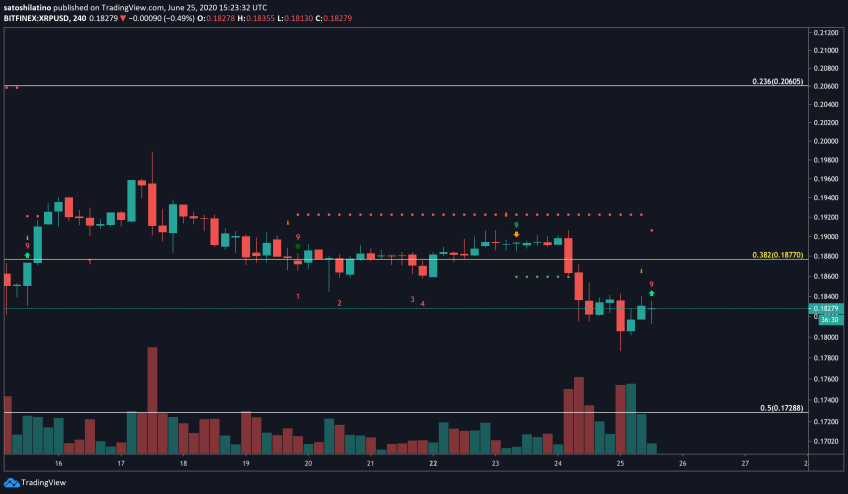
Those who are still bullish on XRP, despite the recent correction, must pay close attention to the 38.2% Fibonacci retracement level. Regaining this critical supply barrier as support will define whether or not the international settlements token has the ability to recover from the losses incurred over the last two quarters.
The Crypto Market Moves Forward
Despite the lackluster price action of Bitcoin, Ethereum, and XRP, there are different developments within the industry that suggest that a new influx of capital is underway. In a recent report, it was revealed that PayPal and Venmo are thinking about adding cryptocurrency buying and selling features to their platforms.
Combined, these companies have 365 million daily active users that may soon have the ability to purchase the crypto of their choice. Such a feature would help accelerate the mainstream adoption of this new asset class.
Even though the news is highly speculative, as it has only been confirmed by anonymous sources, investors must pay close attention. If confirmed, it could be the catalyst that pushes the crypto market into its next bullish cycle.
Source: cryptobriefing.com