Will Bitcoin Begin Yet Another Upward Move?
- The Bitcoin price is trading either in a symmetrical or a descending triangle.
- There is strong resistance at $9,150.
- The price is trading inside a very short-term ascending channel.
The Bitcoin price is currently trading at the resistance line of either a symmetrical or descending triangle. The next few hours will be crucial in determining the correct pattern.
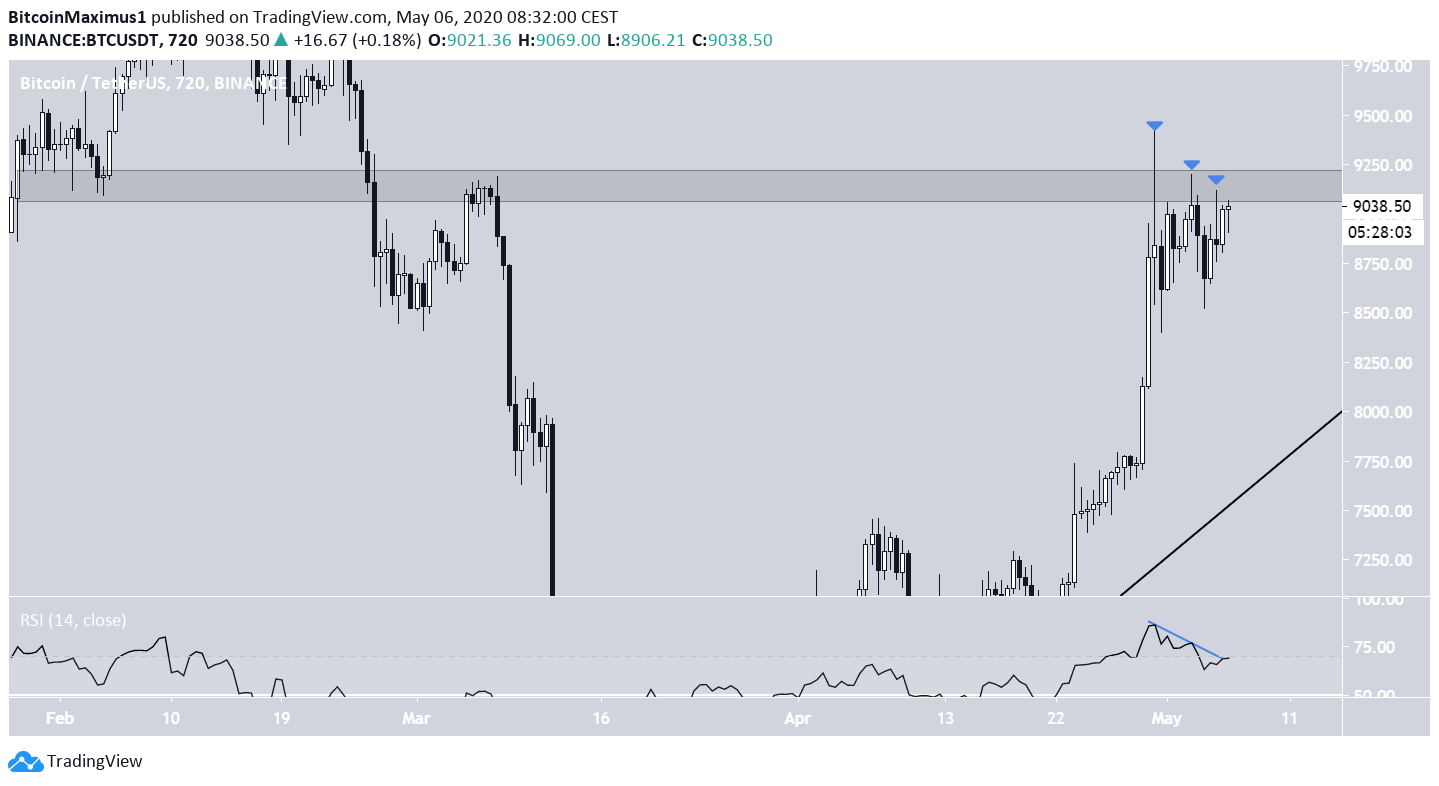
The Bitcoin price is trading just below a major resistance area found at $9,150. Inside this resistance area, the price has created three lower-highs up until this point — a sign of weakness.
In addition, the RSI has generated quite a significant bearish divergence, another sign that the price is likely to head downwards.
If it does, the first minor support area would be found at $8,500, near the April 30 lows, but there would be more significant support slightly below $8,000 at the ascending support line the price has been following since March 13.
Bitcoin Triangle Pattern
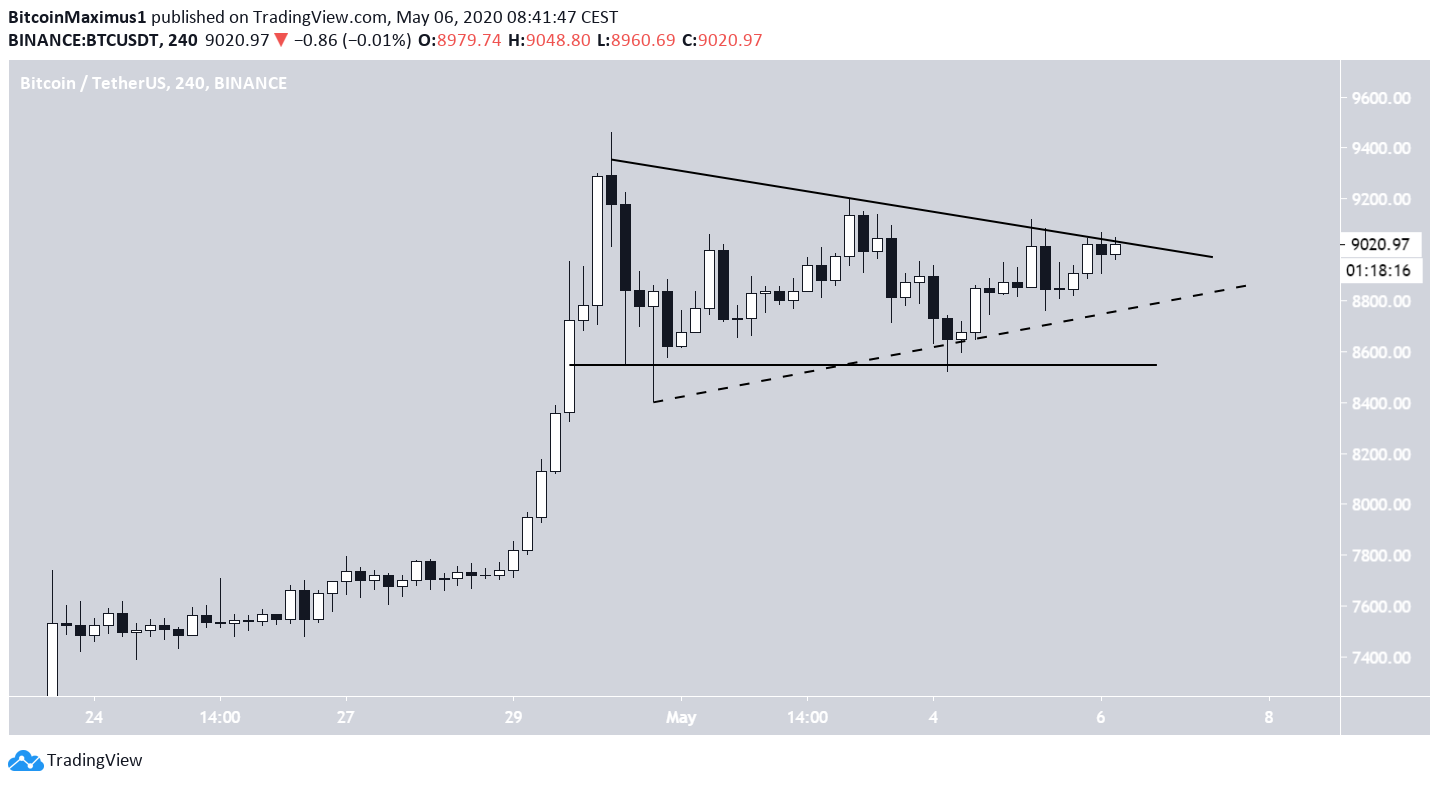
In the short-term, the Bitcoin price is trading either in a symmetrical or descending triangle. While the former (dashed) is neutral, the latter is a bearish pattern. However, even though the symmetrical triangle is considered a neutral pattern, the fact that it is occurring after an upward move would make a breakout likely.
The type of pattern is dependent on the time-frame we are using. Smaller time-frames reveal a symmetrical triangle, while larger-period time frames show a descending triangle, especially when using the closing prices instead of wicks.
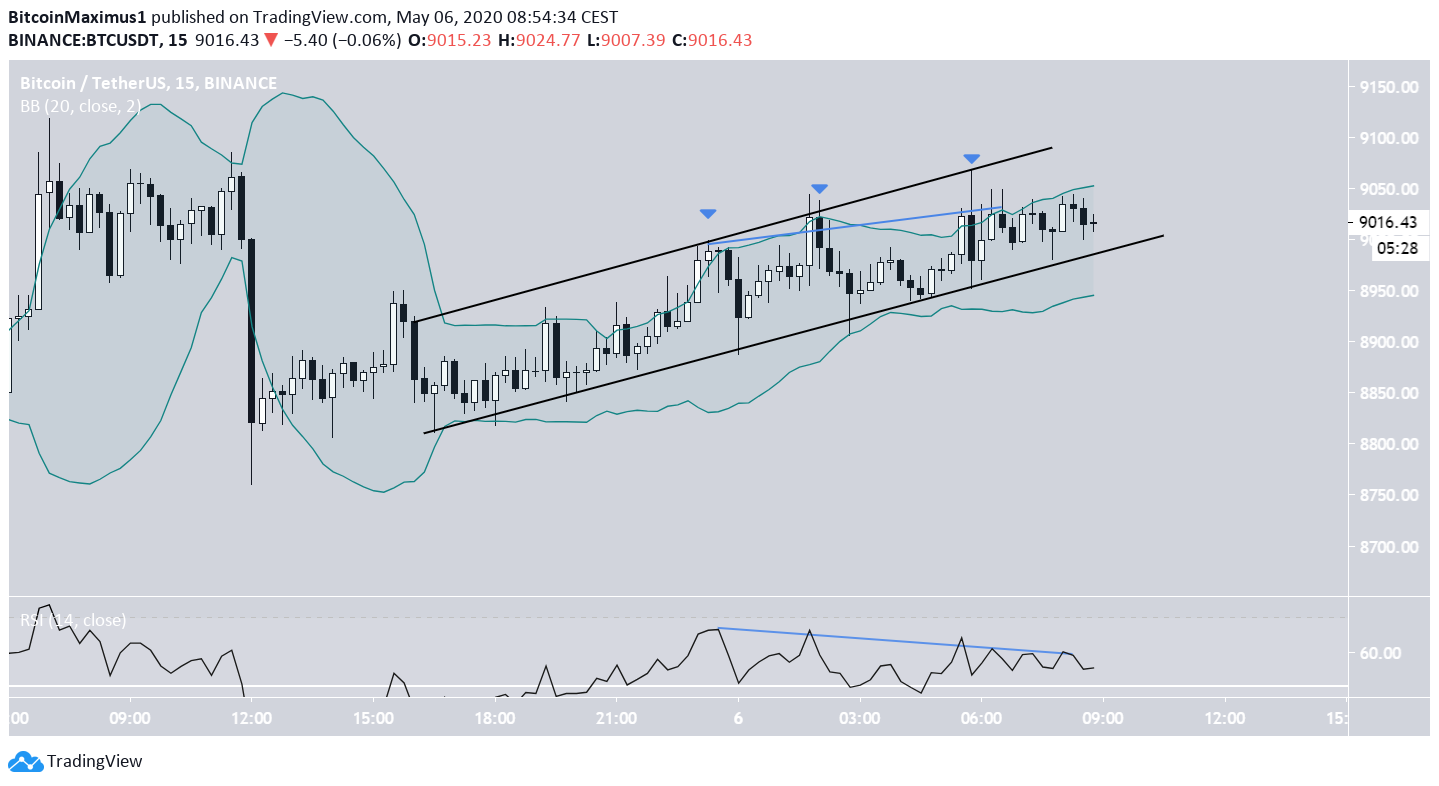
Using the very short-term 15-minute time frame, we can see that the price is also trading inside an ascending channel. The reading from this channel is bearish.
The RSI has generated a significant bearish divergence, and the price has moved above the upper Bollinger band numerous times. This is a sign that the price will likely eventually break down from this channel.
If it does decrease below the dashed ascending support line from the previous chart, it would confirm that BTC is trading inside a descending triangle and will possibly retest the horizontal resistance line at $8,500.
On the contrary, a breakout would likely take the price back to $9,500.
To conclude, the Bitcoin price is trading inside either a descending or symmetrical triangle. A decrease below $8,800 would confirm that the price is trading inside a descending triangle, making a breakdown imminent, while a movement above $9,150 would confirm the latter.
source: https://beincrypto.com/