How Long Will Bitcoin’s Rapid Ascent Continue?
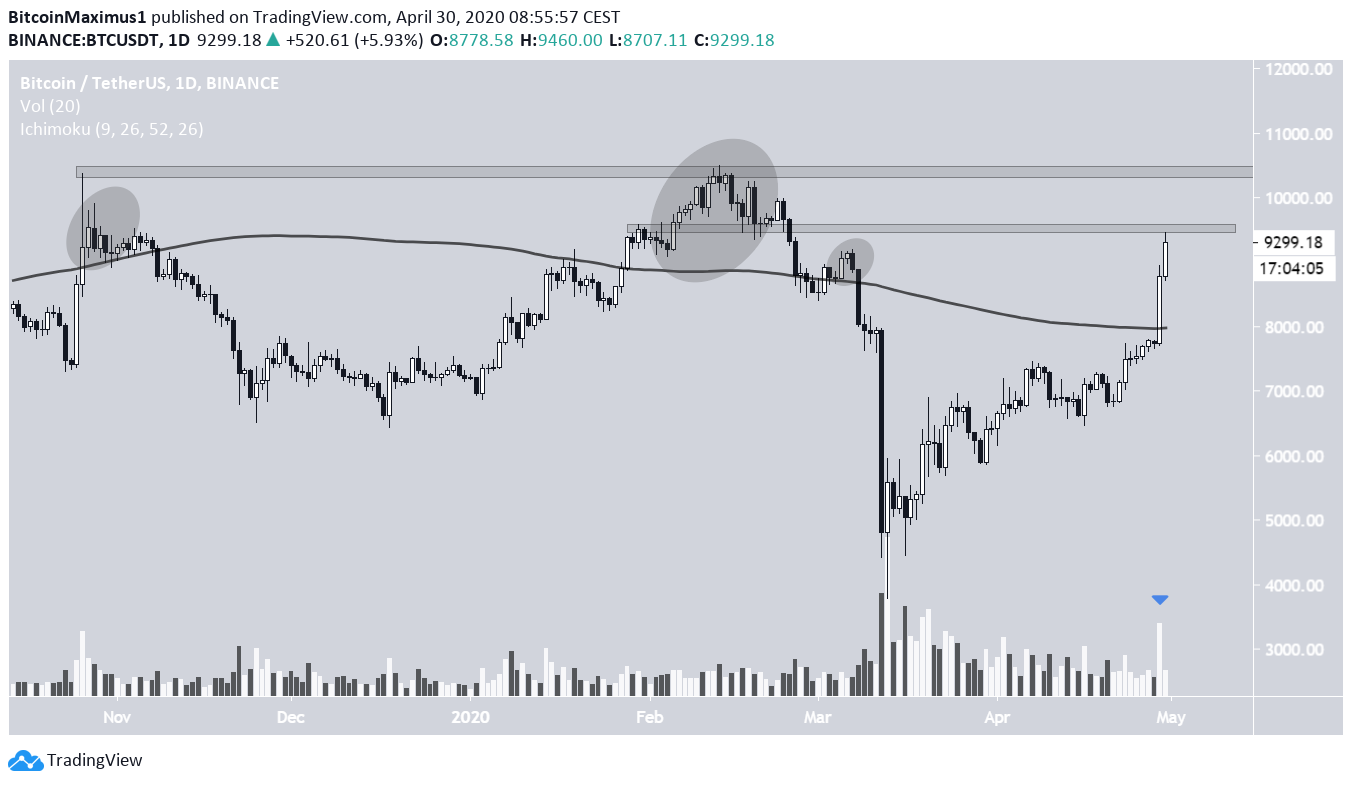
On April 29, Bitcoin (BTC) created a massive bullish engulfing candlestick — which, at its close, had a body of slightly more than $1000. This caused the price to break out above several resistance levels.
Bitcoin’s Breakout
On April 29, the bullish engulfing candlestick caused the Bitcoin price to move above the 200-day moving average (MA). While this is a bullish development, suggesting that the price has moved above a major resistance level, it is worth noting that it has occurred thrice in the past year (and the price has fallen back inside it afterward each time).
However, the breakout occurred with very significant volume, which was not the case in the previous breakouts — increasing the validity of the movement.
There are two resistance areas above the current price, one minor and the other major. The minor resistance level is found at $9400 while the major one at $10,600. The price has not traded above the latter since September 2019.
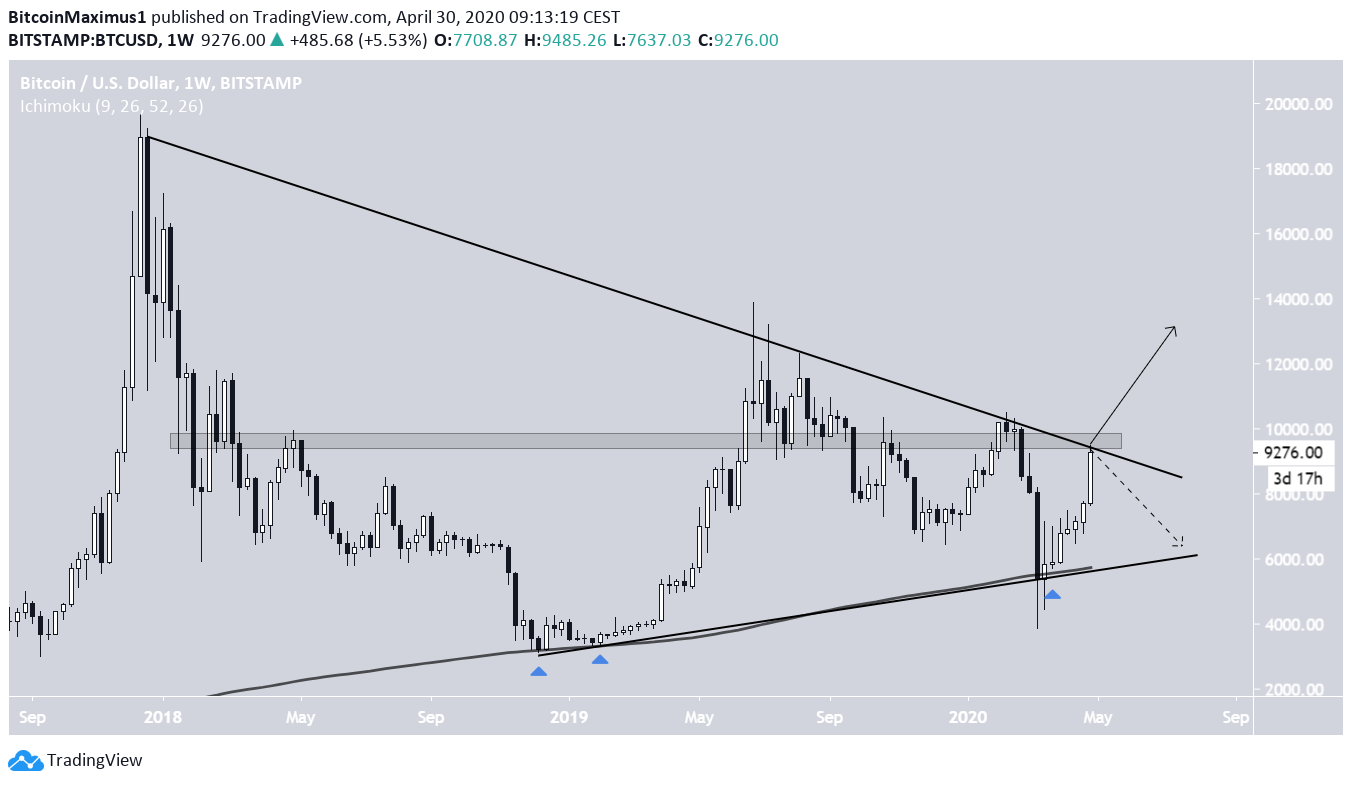
Long-Term Symmetrical Triangle
Looking at the weekly chart, we can see that the BTC price has been trading inside a massive symmetrical triangle since reaching an all-time high in December 2018. At the time of writing, the price was trading right at the resistance line of this pattern. In addition, the $9500-$10,000 area is also a higher time-frame resistance, having acted as a top for numerous previous rallies.
If the price fails to break out above this resistance line, it is likely to drop and validate the ascending support line along with the 200-week MA, which is currently at $6000.
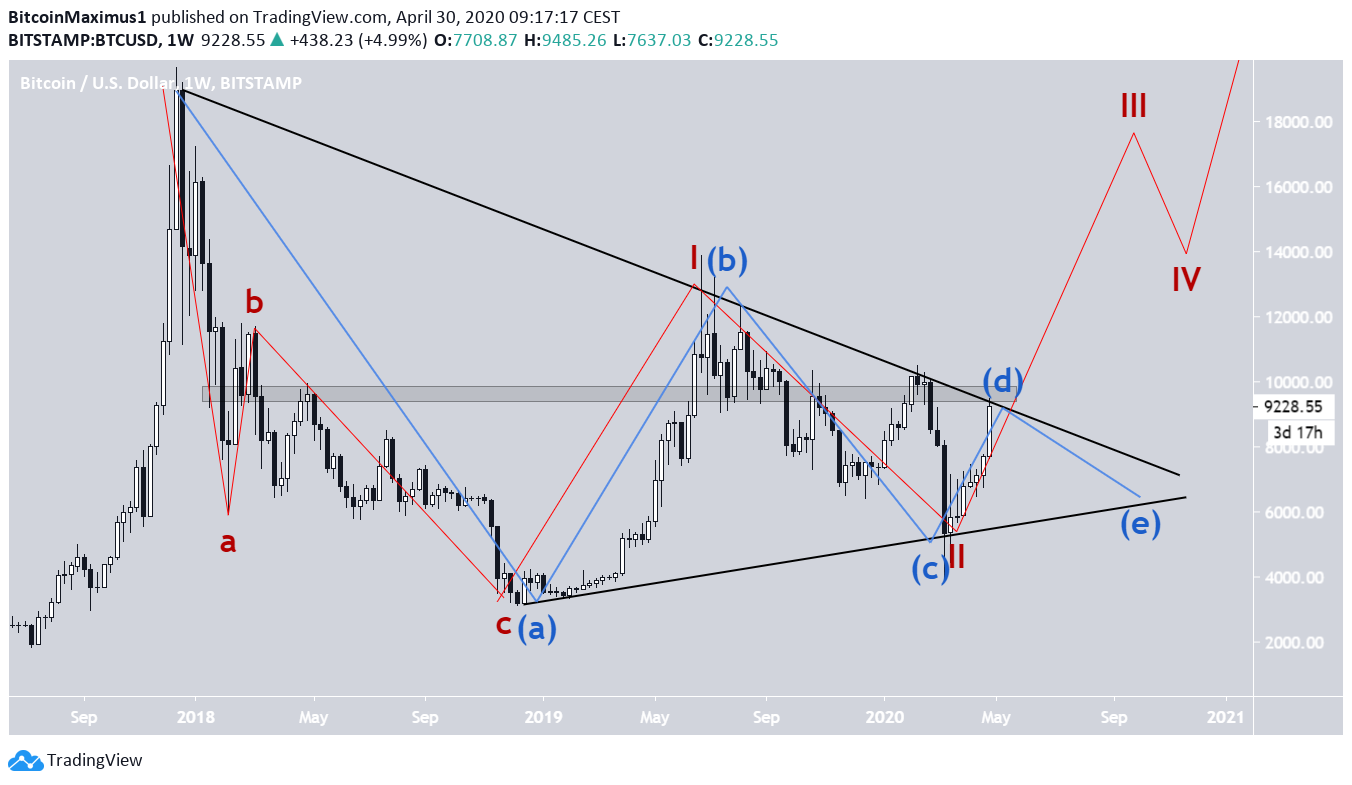
As for the wave count, the bullish scenario is shown in red in the image below. It suggests that, beginning in December 2017, the Bitcoin price has completed an A-B-C correction at the bottom in December of the following year. In this case, the price has already begun a new five wave Elliott formation and is currently in the (III) wave.
The bearish option is shown in blue. It suggests that the price is still mired in a correction, albeit an A-B-C-D-E one, which is very common in symmetrical triangles. If this one is followed, the price will reach a high at the resistance line and drop towards support before eventually breaking out.
Either way, it looks likely that the March 13 bottom values will not be reached in the near future, if at all.
Source: paulcrypto.com