ETH/BTC is trading 2.37% lower on Wednesday as BTC outperforms against the rest of its peers.
The price has made a lower high and broken through a significant support level.
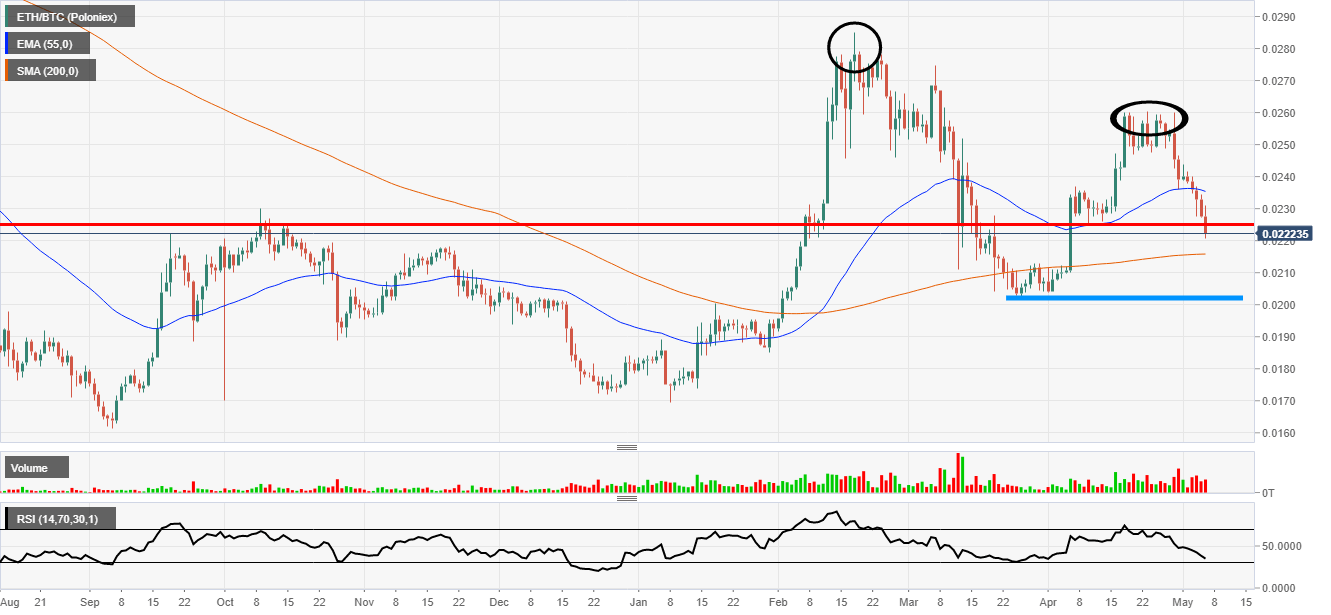
ETH/BTC daily chart
Ethereum is breaking lower against the king of digital cryptocurrencies (bitcoin). The price has dropped 2.37% on Wednesday’s session alone. The key for the current session was the break of the red trendline at 0.2250. Now to complete the pattern the price would need to break the low just above the 0.0200 psychological zone. This would make a lower high lower low price wave pattern.
Looking at the volume indicator the market seem to be backing this move. The volume steadily increased as the price fell and this is a good sign for the bears. The relative strength index indicator is looking very oversold. This could suggest there is a short term pullback in the making before the underlying trend continues.
As U.K. warships sortied planes and fired cruise missiles at Houthi-controlled sites in Yemen Thursday, American F/A-18s sat pilotless on flight decks, and cruise missiles were dormant in vertical launch tubes—even though Kamala Harris and Read more…
PayPal has today announced the launch of cryptocurrency buying, holding and selling services for UK customers. The service “starts rolling out this week” and is the first expansion of the company’s crypto-related services outside the Read more…
Dutch GP organisers have had to inform a third of the ticketed spectators for the forthcoming Formula 1 race at Zandvoort that they can no longer attend. With government authorities ruling that only two thirds Read more…