Crypto Traders Explain Where Bitcoin Price Can Go After Fifth $10K Test in 11 Days
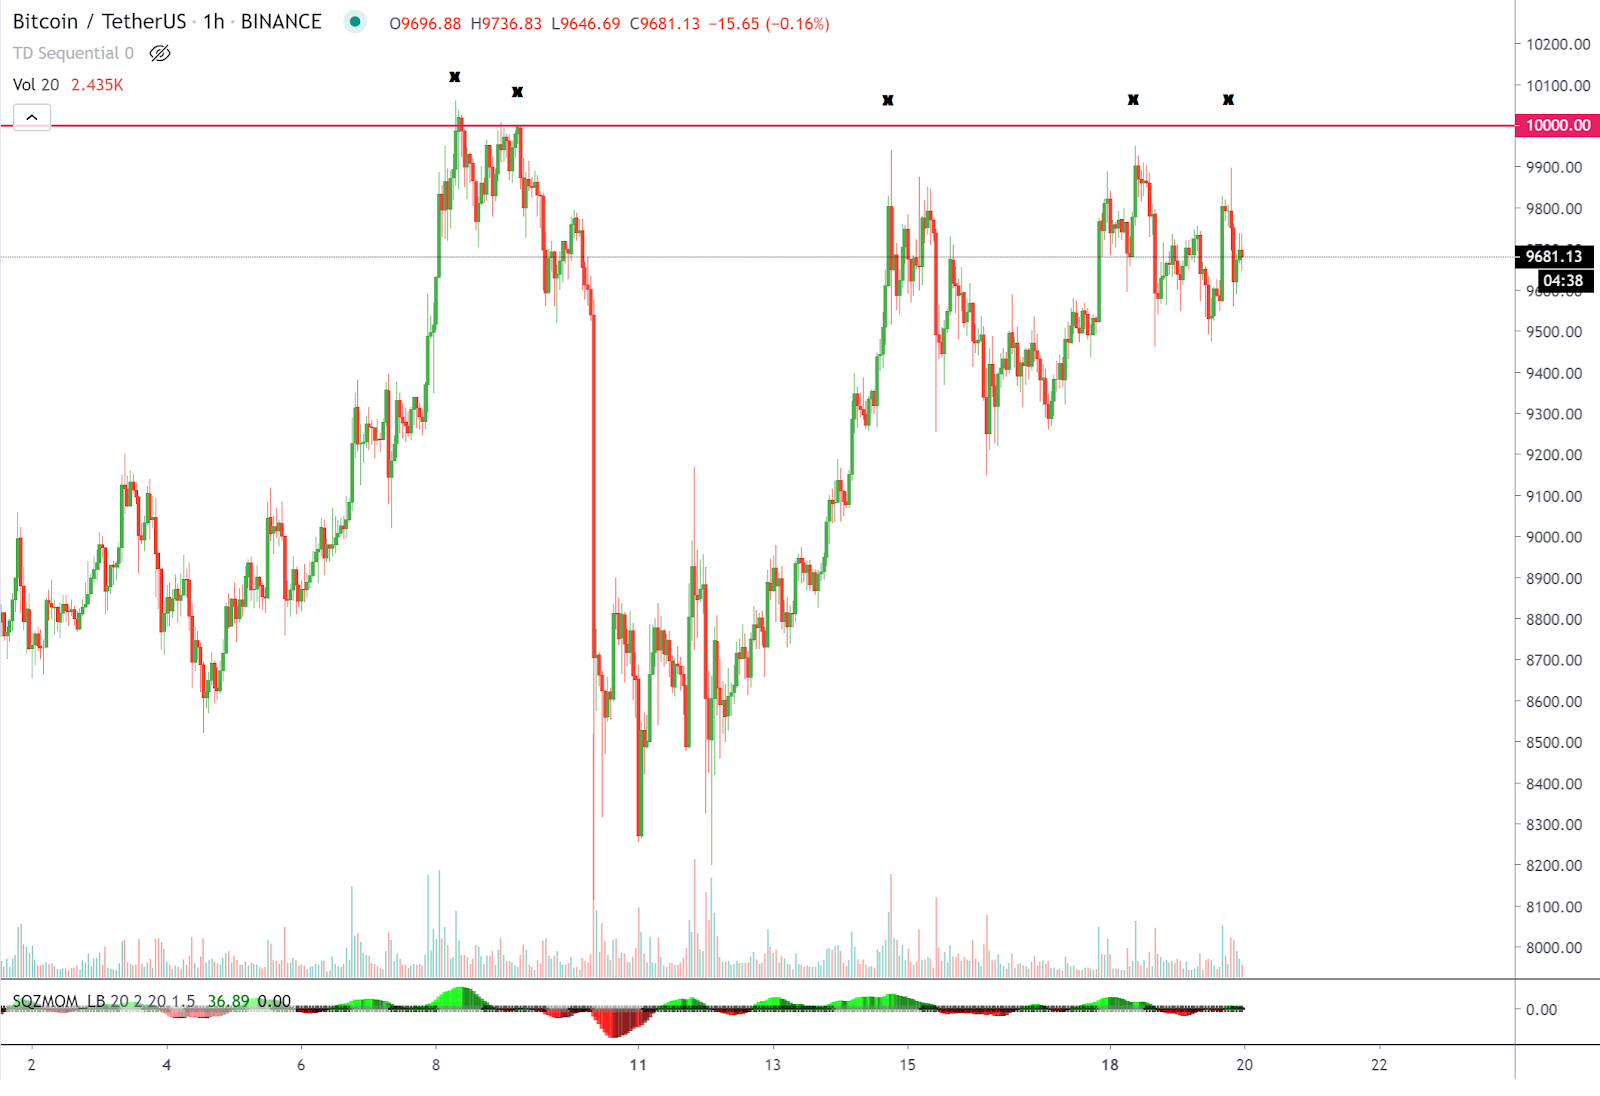
The price of Bitcoin (BTC) tested $10,000 a total of five times in the past 11 days. The price action can be considered as a bullish or a bearish trend based on varying perspectives. The quintuple test of a key psychological level at $10,000 can be analyzed in two ways: The $10,000 resistance level is getting weakened with every test, or the resistance is so strong that buyers are not able to break out of it.
Many top crypto traders believe that the mid-$9,000 area is a starting point to a new extended rally to the $14,000-to-$15,000 resistance range and with $20,000 as a medium-term target. Others foresee a sizable pullback to the $7,000-to-$8,000 region first, before Bitcoin’s price can aim for $14,000 and then attempt to break the record high.
The short-term, bullish scenario for Bitcoin
Traders who expect the price of Bitcoin to reclaim the $10,000 resistance level as support and see a rally to key levels above it predict that the resistance area was weakened with multiple spikes to the $9,800-to-$9,900 range.
Traders continue to debate whether the current price trend of Bitcoin the start of a bullish uptrend following the highly anticipated block reward halving on May 11. Fundamentally, the block reward halving is a highly optimistic event for Bitcoin’s price because it directly affects the supply of BTC, as it halves the amount of Bitcoin mined, decreasing the rate, at which new BTC is produced and, subsequently, how much is sold on the market.
Historically, the halvings of 2012 and 2016 both resulted in at least a 2,500% increase in price. Hence, the bullish trajectory of BTC is that the halving will push the price of Bitcoin forward in both the short-term and the long-term.

Source: cointelegraph.com