Bitcoin Just Made a Fresh April High, But Still Facing Its Real Major Test: BTC Price Analysis & Overview
Bitcoin starts the week following a bullish weekend. Just as anticipated, Bitcoin broke above the $7600 to a new price high since the devastating collapse on March 12. As of writing these lines, Bitcoin marks $7800 (Bitstamp) as the new high.
Following our previous BTC analysis from Saturday, we can see that Bitcoin broke above the 4-hour chart’s marked triangle (at $7600) and quickly reached the prior high of $7750, and even created a fresh high.
The bullish momentum is seeing back-winds from the Wall Street futures, that forecast 1% gains into the Monday trading day, as of writing these lines.
Trouble Ahead?
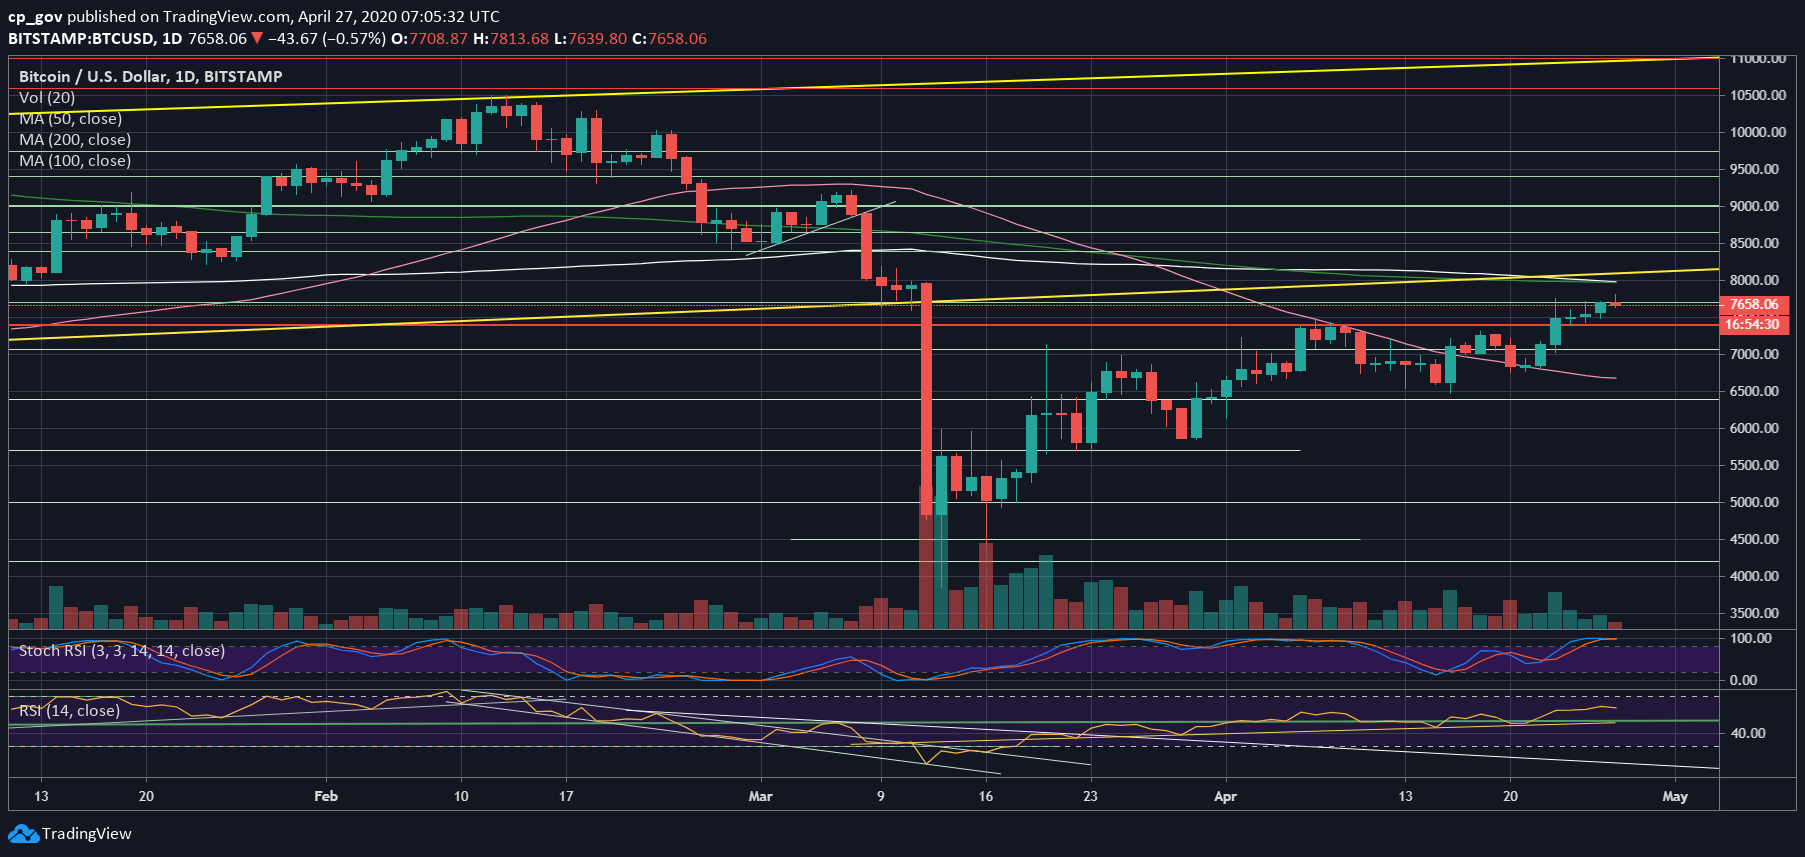
With all the joy, we need to remember that the real resistance, or real test, lies around $8000 – $8100.
This includes the benchmark level, along with the long-term ascending trend-line (which started forming in April 2019), and on top – the 100 and 200 days moving average lines (marked white and light-green respectively).
The latter is also the level where the massive collapse had initiated from, on March 12, so hitting this zone would mean a full-recovery from the COVID-19 damage for Bitcoin, along with a phenomenal 120% in 1.5 months (!).
Total Market Cap: $221.5 billion
Bitcoin Market Cap: $141.5 billion
BTC Dominance Index: 63.8%
*Data by CoinGecko
Key Levels To Watch & Next Possible Targets
Support/Resistance levels: After breaking above the $7600, this had become the first level of support. In case Bitcoin breaks below, then we can expect prior resistance turned support at $7400 – $7500, along with the 4-hour ascending trend line, to provide some confidence. Further below lies $7200 and $7000.
From above, the first level of resistance now lies at the new monthly high around $7800. Further above is the mentioned zone of $8K, while higher above lies the $8400 price level.
The RSI Indicator: So far, the RSI follows the price of Bitcoin and supports the bullish trend. The RSI now trades around 63, which is the highest level since February 18, when Bitcoin was priced above $10,000.
However, the Stochastic RSI oscillator is nearing a cross-over at the overbought territory, which may lead to some technical correction.
Trading volume: Despite the excitement and the bullishness, this section is a red flag. Since the March 12 crash, and especially over the past bullish week, we are seeing declining candles of the trading volume. If the bulls manage to take over the market, we better notice higher amounts of daily volume.
BTC/USD BitStamp 4-Hour Chart

BTC/USD BitStamp 1-Day Chart
Source: cryptopotato.com